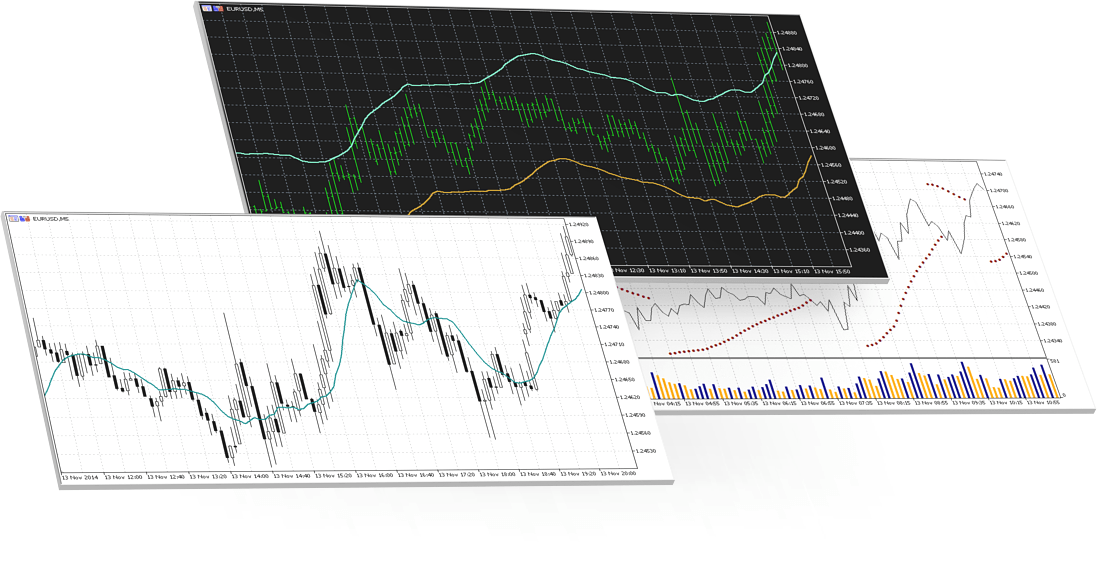
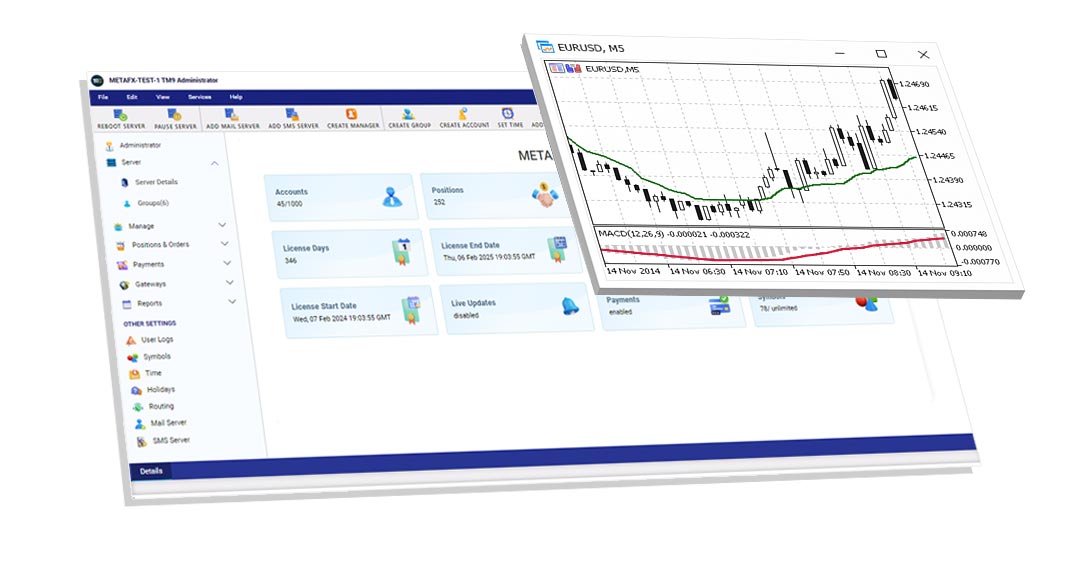
Trade Master 9 charts visualize changes in currency, stock and other security quotes. Charts enable technical analysis and operation of trading robots. Charts allow traders to visually monitor quotes of financial instruments in real time and respond instantly to any changes in the market.

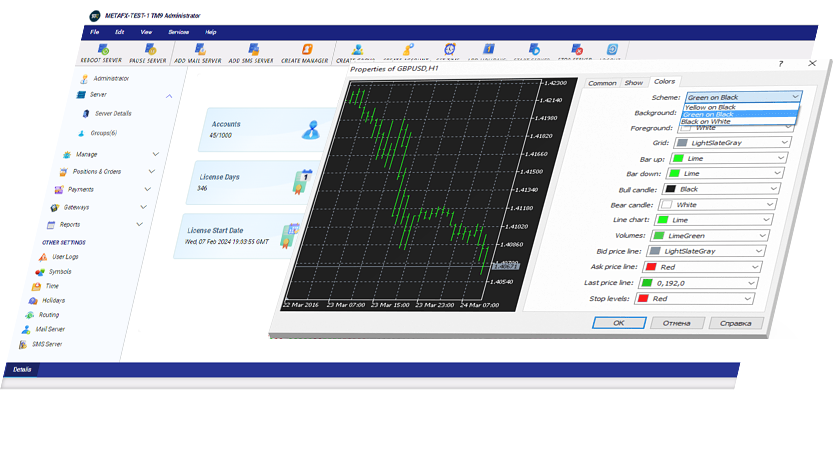
Charts offer a variety of different settings, so that traders can customize and adapt these settings to their personal needs. Trade Master 9 supports three types of charts: broken line, sequence of bars and Japanese Candlesticks. You can set a separate color for any item in the chart and create the most comfortable workplace for long-term work.

Trade Master 9 charting system includes:
- 21 timeframes for any financial instrument
- dozens of analytical tools
- color schemes
- templates and profiles
- manual scaling
Trade Master 9 provides the use of various chart templates and profiles. With these templates you can save color schemes and analytical objects applied on a chart, while all the open chart templates can be saved on one profile. By using these templates and profiles, you can easily and quickly restore the working area of your platform whenever such automation is considered necessary.
Trade Master 9 gives the availability of 21 timeframes, from one-minute to one-month, so that traders can easily choose the type of quote visualization that best suits their trading system. Moreover, it is also possible to set up visualization of additional information (tick volumes, last price, OHLC and others). As a result, this will help you trade and analyze quotes more efficiently.

The tools provided by Trade Master 9 charts can be widely used for all the analytical purposes. The platform offers more than 80 of the most popular analytical tools: technical indicators and graphical objects.
The analytical objects can be added directly to a symbol price chart or in its separate sub-windows. An unlimited number of analytical tools can be also applied to the chart for the analysis of the price dynamics from various perspectives.
Finally, it is possible to construct charts based on other indicators' data. For example, traders may apply the Bulls Power indicator together with Bears Power and smooth the data by using the Moving Average.
In summary, Trade Master 9 charts provide all tools needed for convenient and comprehensive technical analysis. You can customize charts based on your choice and analyze quotes using technical indicators and objects — with the Trade Master 9 this could not be easier!