App preview
Inside Trade Master 9.
Price charts, technical indicators and analytical tools for studying how a market is actually moving.
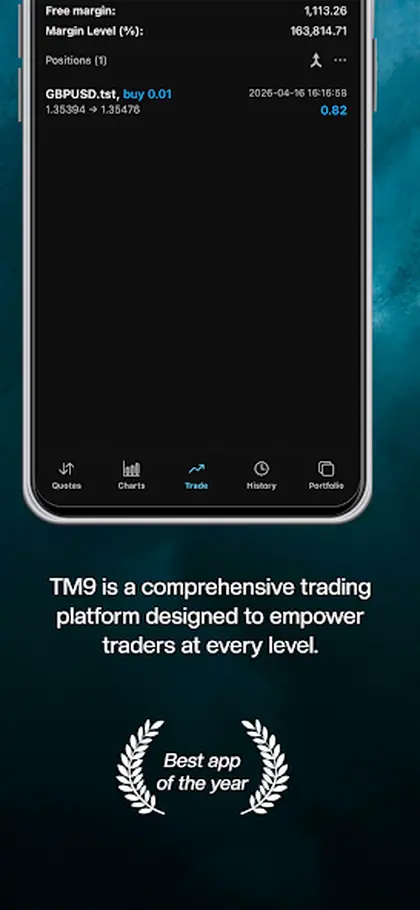
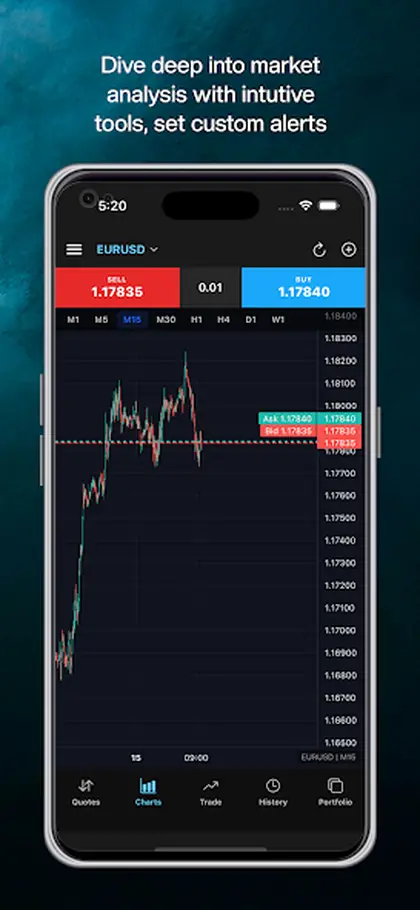
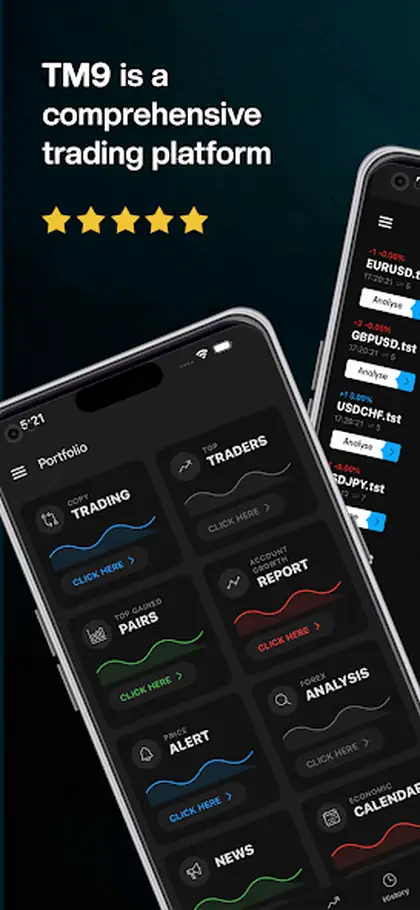
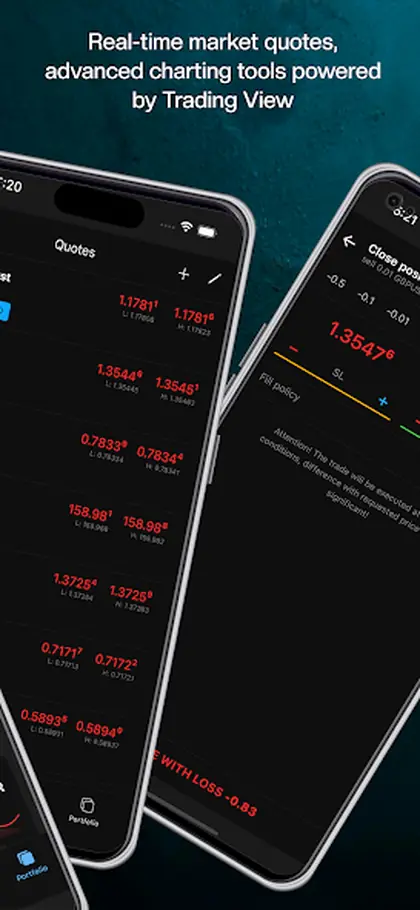
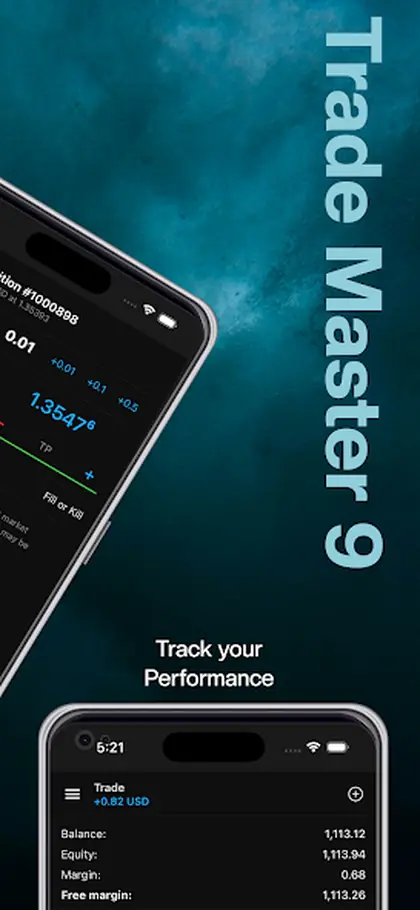
Reading price is the core skill behind any operation in the Forex and exchange markets.
Price charts, technical indicators and analytical tools for studying how a market is actually moving.
Analysing price movements is the skill everything else rests on, and the TM9 Web Platform puts the tools for it in a browser tab: price charts, technical indicators and analytical tools for studying how a market is actually behaving rather than how you would like it to behave.
The work is mostly comparison. A longer timeframe supplies context, a working timeframe supplies the setup, and the difference between them is where most bad trades are avoided. An apparently strong move on a five-minute chart often looks like noise inside a range on a four-hour one, and seeing both is what turns a reaction into a decision.
Two or three levels drawn on a chart usually beat twenty. The ones worth marking are those you would genuinely act on — a level where you would enter, a level where you would accept you were wrong. Everything else is decoration that makes the chart harder to read when it matters.
Because the order ticket sits in the same window, acting on a read does not mean switching applications. For the complete picture of the platform, see the TM9 home page.
Price charts, technical indicators and analytical tools for studying how a market is actually moving.
Read price action in the browser with charts, technical indicators and analytical tools.
Comparing a longer view with a working view is what separates context from noise.
Analysis and execution sit in the same browser window, so acting on a read does not mean switching applications.
Three short notes on how this works day to day.
Marking two or three levels that genuinely matter beats covering a chart in lines. The levels you would actually act on are the only ones worth drawing.
Past price movement describes behaviour rather than predicting it, and trading carries a real risk of loss whatever the chart suggests.
This page is for chart-led traders, and for anyone learning to read price without a screen full of indicators.
How web platform sits inside the Trade Master 9 platform.
TM9 is a web-based trading platform for Forex, stocks and futures, combining technical analysis, fundamental market information, copy trading and automated trading in one browser window. It runs on virtually any modern browser and operating system with no desktop software to install, is designed to offer functionality comparable to the desktop environment, encrypts data between the browser and the platform, and supports both demo and real accounts.
TM9 is a software development company and does not provide investment or brokerage services. The platform supplies the trading terminals, analysis tools and automation; your broker holds the funds, sets spreads and leverage, and executes the orders the platform sends. Trading carries a real risk of loss, and signals or robots are tools rather than financial advice.
TM9 Web Trading Platform. Trade From Your Browser. Trading With No Download. Or open the Platform Guide for all 77 pages.