App preview
Inside Trade Master 9.
Price charts and analytical tools sit at the centre of the web platform, for studying market conditions and identifying potential opportunities.
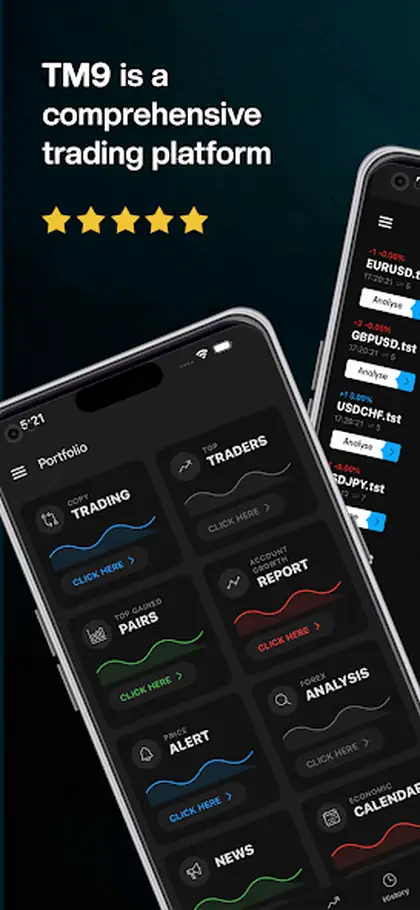
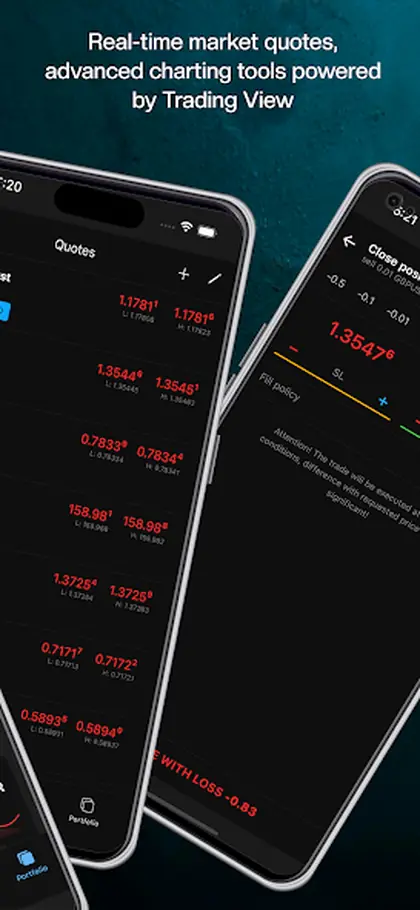
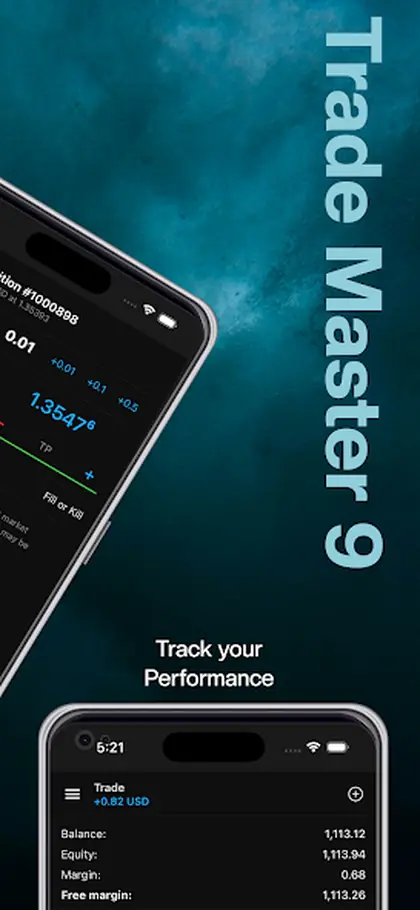
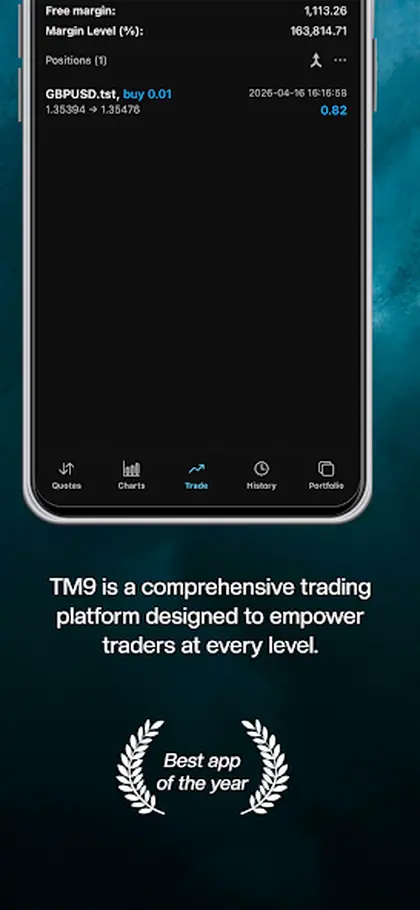
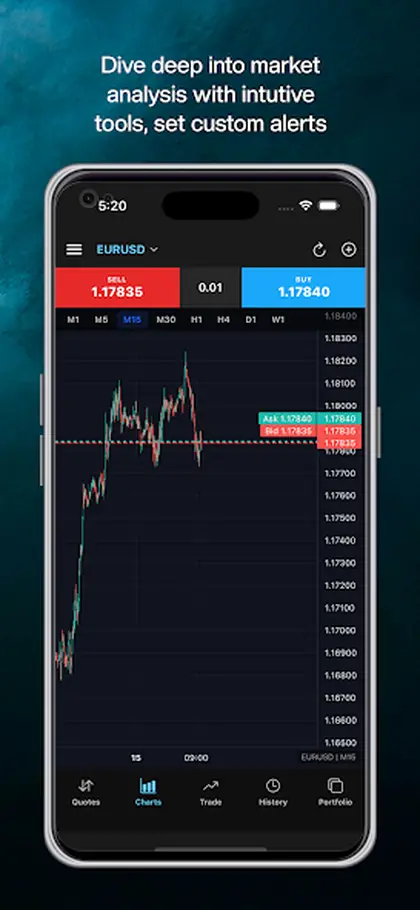
Charting is the heart of any platform for operations in the Forex and exchange markets, browser-based or not.
Price charts and analytical tools sit at the centre of the web platform, for studying market conditions and identifying potential opportunities.
Everything in a trading session eventually comes back to the chart, which is why the charting side of the TM9 Web Platform matters more than any other single feature. Price charts, technical indicators and analytical tools are available in the browser so traders can study market conditions and identify potential trading opportunities without installing anything.
Reading a chart well is mostly about what you leave off it. A browser workspace nudges you in that direction: fewer panels competing for room, so most traders settle on a clean price view with two or three studies they actually understand. That is usually an improvement on a screen so crowded with indicators that the price itself is hard to follow.
Charts do not sit in isolation here. Fundamental market information is part of the same platform, so a level that looks technically interesting can be checked against what is happening in the wider market in the same session. Trading tools and account management are in the same window too, which means analysis, decision and execution are not scattered across three applications.
Switching timeframes is where most of the day-to-day work happens, so it is worth getting comfortable with moving between a context view and a working view early on. Because everything belongs to the account rather than the machine, chart work is portable. Analysis started on one computer is available when you log in from another, which matters for anyone who moves between an office and home during a trading week.
The platform provides the tools; the method is yours to build, and the pages on indicators, fundamental data and strategy development cover the rest of that work. For the complete picture of TM9 across web, mobile and desktop, see the TM9 home page.
Price charts and analytical tools sit at the centre of the web platform, for studying market conditions and identifying potential opportunities.
Price charts and analytical tools in the browser, for studying market conditions and finding opportunities.
Charts sit alongside fundamental market information, so both sides of the picture are available in the same session.
Trading tools and account management are in the same browser window, so analysis and execution do not live in separate places.
Three short notes on how this works day to day.
Working in a browser encourages a cleaner chart. With less screen furniture around it, most traders settle on two or three studies and read price more directly, which is rarely a bad outcome.
Chart work done in the browser belongs to the account rather than the machine, so moving to another computer does not mean starting the analysis again.
This page is for chart-led traders trying the web platform, and for anyone comparing its analysis tools with an installed terminal.
How web platform sits inside the Trade Master 9 platform.
TM9 is a web-based trading platform for Forex, stocks and futures, combining technical analysis, fundamental market information, copy trading and automated trading in one browser window. It runs on virtually any modern browser and operating system with no desktop software to install, is designed to offer functionality comparable to the desktop environment, encrypts data between the browser and the platform, and supports both demo and real accounts.
TM9 is a software development company and does not provide investment or brokerage services. The platform supplies the trading terminals, analysis tools and automation; your broker holds the funds, sets spreads and leverage, and executes the orders the platform sends. Trading carries a real risk of loss, and signals or robots are tools rather than financial advice.
TM9 Web Trading Platform. Trade From Your Browser. Trading With No Download. Or open the Platform Guide for all 77 pages.