Trading
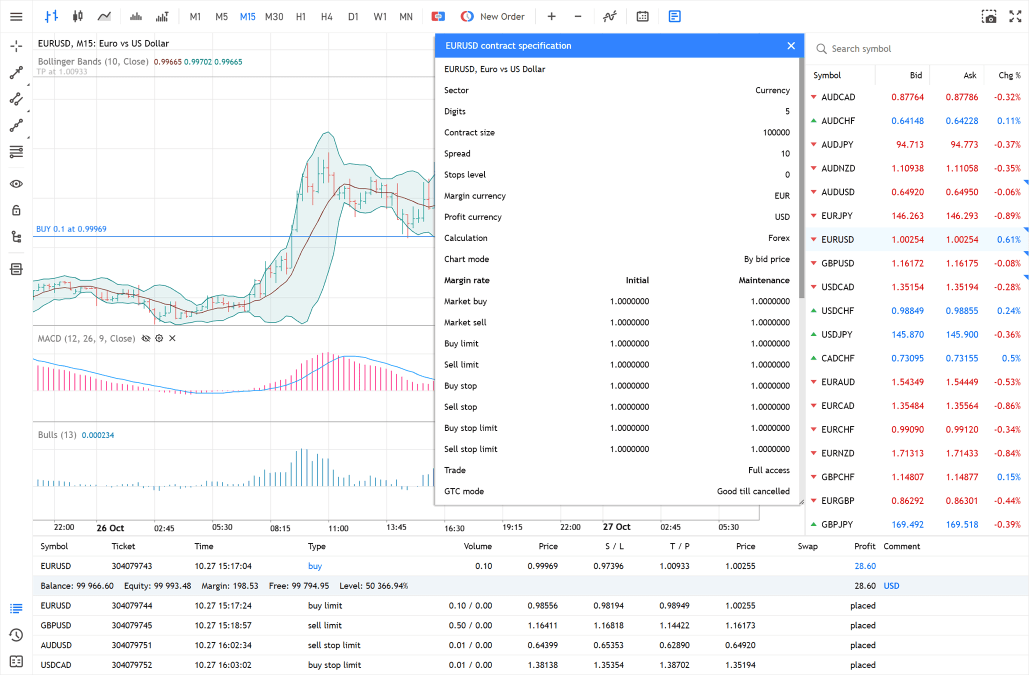
Trade Forex, stocks and futures. Gain the widest opportunities for
trading currencies, stocks and other instruments: technical and
fundamental analysis, algorithmic trading, two position accounting
systems, a full set of trading orders, one-click trading, and more.
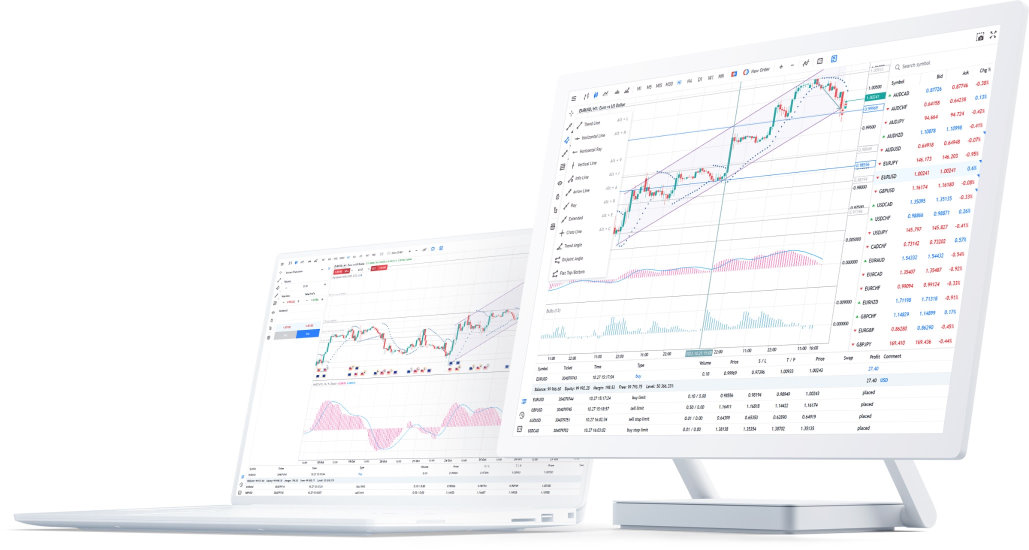
Netting and hedging position accounting systems
You have access to two order accounting modes: the netting mode is
adopted on exchange markets, while the hedging method can be used for
Forex trading. With the netting system, the trader will be able to have
only one open position of a financial instrument at a time. The volume
of that position can be increased or reduced through any further
operations on the same symbol. With the hedging system, any new deal on a
financial instrument opens a new position. Individual Stop Loss and
Take Profit levels can be set for each of the open positions.
Full set of trading orders and all types of execution
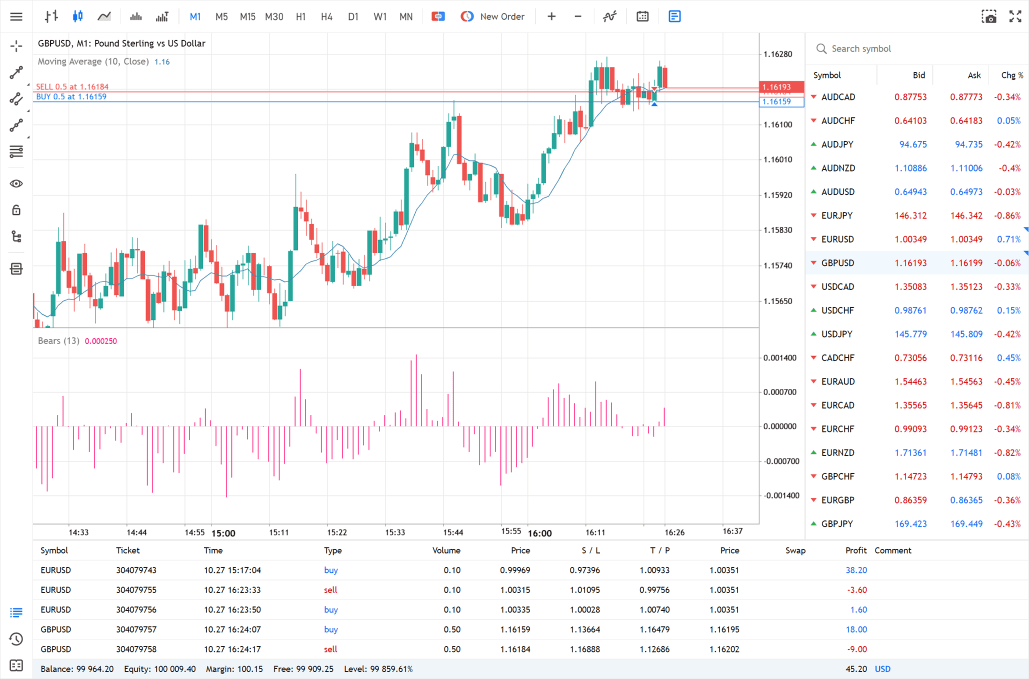
The web platform supports all types of trading orders, including
market, pending and stop orders, as well as Trailing Stop. Four order
execution modes are available to meet various trading objectives:
Instant, Request, Market and Exchange execution.
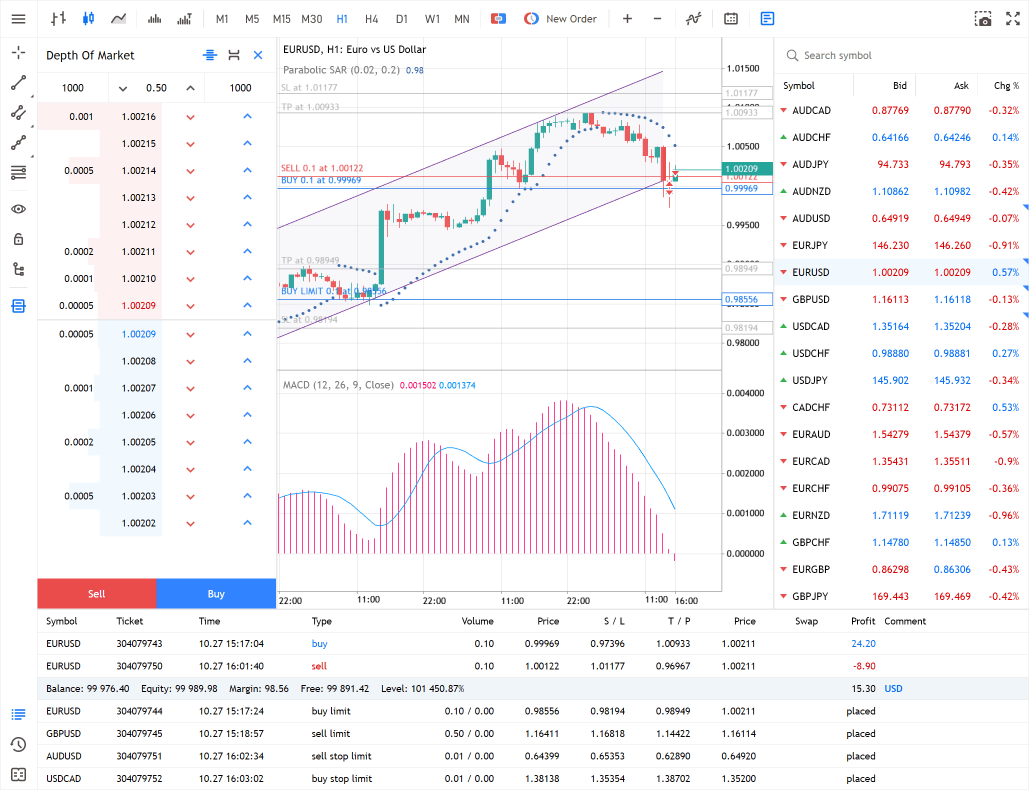
Advanced market depth and one click trading
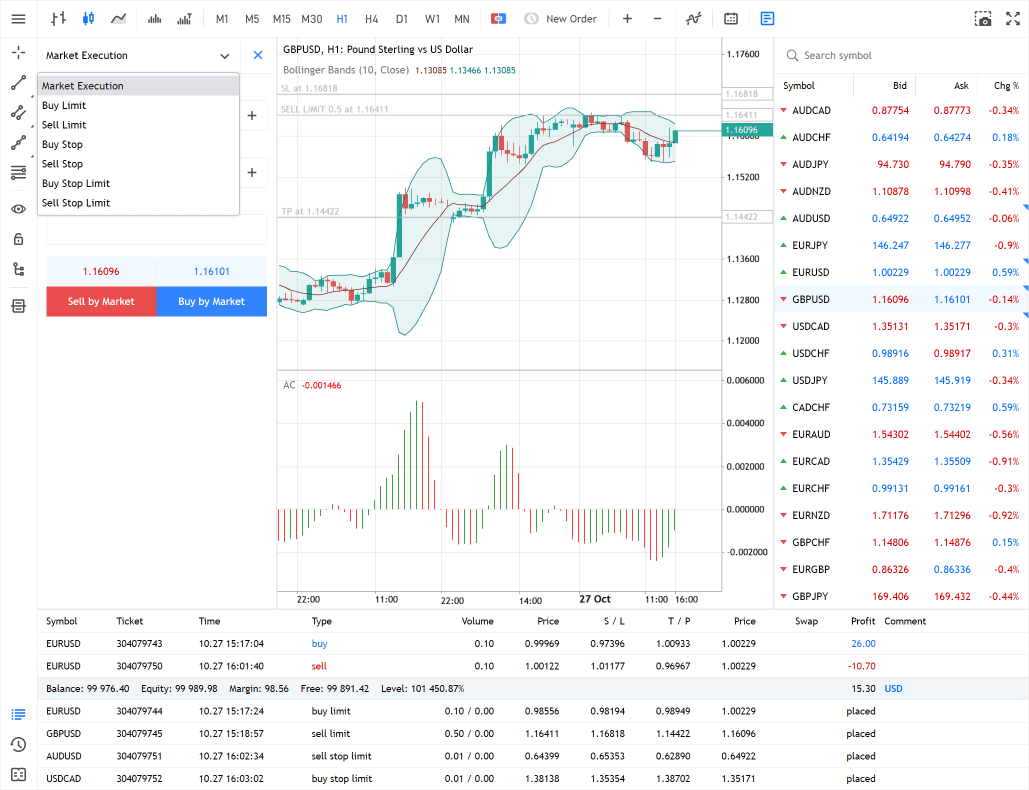
The market depth is one of the basic tools reflecting supply and
demand for liquid tradeable assets. It displays buy and sell offers for a
financial instrument at the best prices, which are closest to the
market one. Using the market depth in Trade Master 9, you can buy or sell
financial instruments at the current market price as well as place
pending orders at desired prices. The market depth allows users to
manage stop levels (Stop Loss and Take Profit) of open positions and
pending orders in one click.
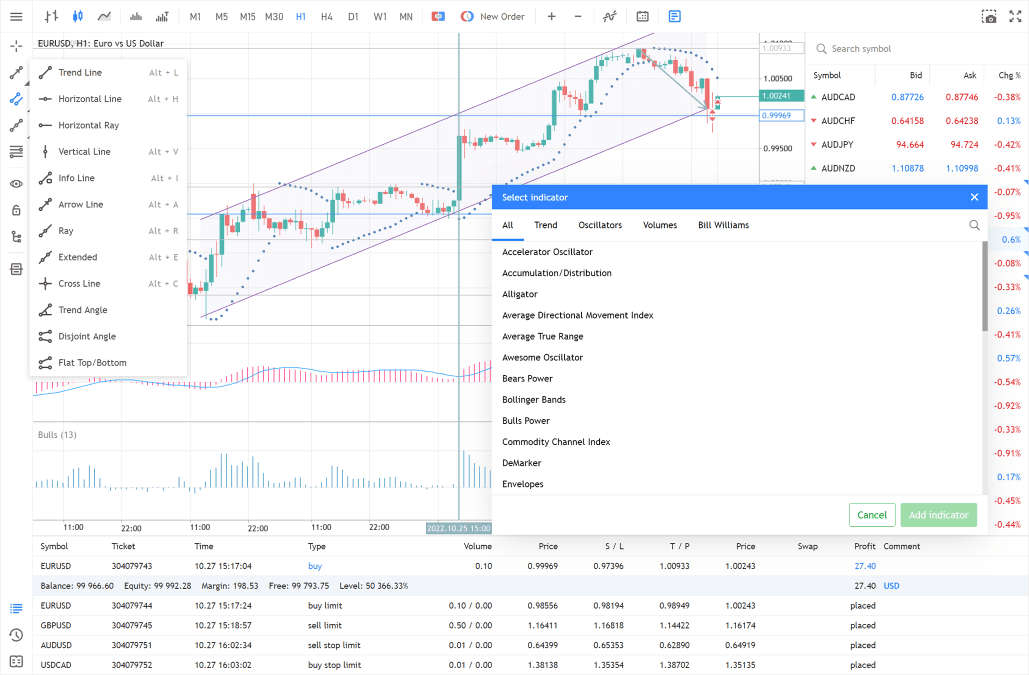
30 indicators and 24 graphical objects for technical analysis
The platform features the most popular technical indicators: trend
indicators, oscillators, volume indicators and Bill William's tools. The
settings of most indicators allow you to adapt them to specific tasks.
You control both analytics and appearance. Indicators can be added to
price charts or to a separate sub-window with an individual scale of
values. Some tools can be superimposed on others: for example, you may
apply a Moving Average on DeMarker and obtain a line of averaged values.
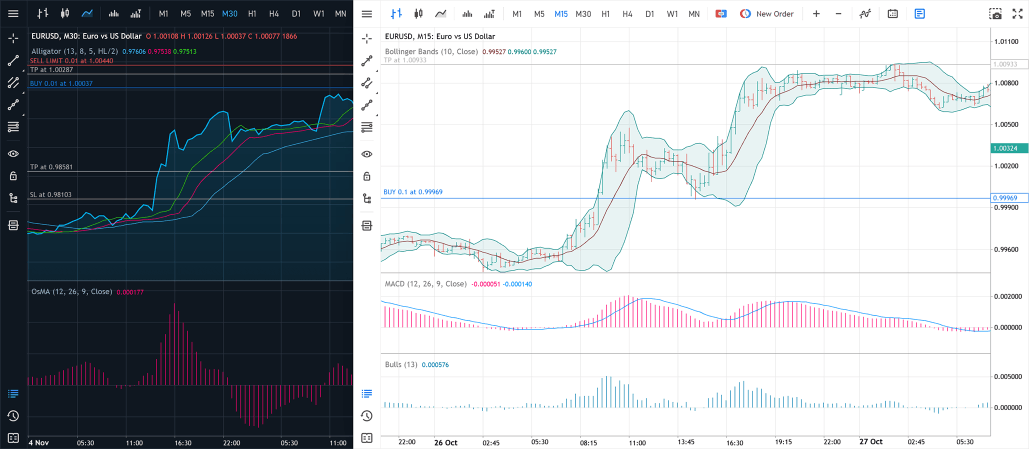
3 chart types and 9 timeframes
Multiple settings allow you to adapt the charts to your requirements
and create an efficient workspace. The platform supports three types of
charts: broken line, bars and Japanese Candlesticks. 9 timeframes are
available for each chart — from one minute to one month. Stock and
currency quotes can be presented on the timeframe which suits your
trading system best. In addition, the charts display additional
information that facilitates technical analysis: tick volumes, last
price lines, OHLC and more.
Real-time quotes in Market Watch
View price data of financial instruments: quotes, price statistics and tick chart. Analyze contract specifications and perform trades in one click.
